 This evening I updated the SID page. After quite some time of feeling adrift in the land of HTML and CSS, I do begin to feel more comfortable, more adept at styling elements on a page, using classes and ids, etc. Thus, I had a fun time cleaning up the page and making it beautiful and functional 🙂
This page helps my APES students practice a method used to better understand the relative overall species diversity of an ecosystem. I say relative, as I believe that the value that is generated by the SID equation is most useful in comparing two ecosystems (two deciduous forests, two intertidal zones, two riparian buffers, etc). Species diversity can be measured as the number of species present (richness) and also as the evenness in the number of each species present. Simpson’s Index of Biodiversity takes into account both species richness and species evenness. The result varies from 0 to 1, and is the probability that one would randomly collect two individuals of different species.
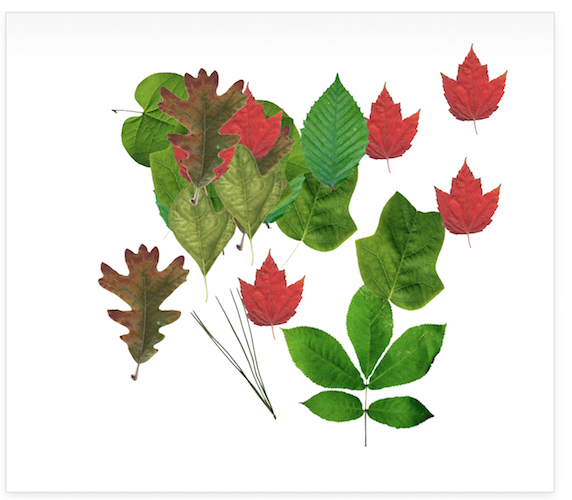
Of course, ideally we would be out in the field or the forest conducting a survey of species along a transect. Given time restrictions however, I recreate two sample forests by assembly collections of tree leaves of different species — constructing two forests (one that has greater species richness but is very uneven, and the other that is very even but that is poor in species), and create a key to the species by affixing leaves (and associated common names) to the classroom whiteboard. I use this activity to introduce some of the more important native habitat trees (and a couple invasive species) of the mid-Atlantic. Unfortunately, many of my students are not able to identify local trees, so I feel that this is a valuable use of time.
Click on the image above to explore the activity!